Importing data into QIIME 2
Contents
Importing data into QIIME 2
A QIIME 2 analysis almost always starts with importing data for use in QIIME 2. This step creates a QIIME 2 archive from data in another file format, such as fastq or biom. To import data into QIIME 2, you need to define the file type and semantic type of the data.
I’ll get straight to the point: in addition to being the first step in a user’s QIIME 2 analysis, importing is often the most challenging step. The reason it’s challenging is that there are tens or even hundreds of different file types that users would like to use with QIIME 2, and many file formats in bioinformatics are poorly defined. For example, the ete3 phylogenetic analysis and visualization toolkit recognizes (as of this writing) 11 different variants of the newick file format. A newick file doesn’t include explicit information in it on which of these variants it is, so it’s up to the person working with the file to know that. A user importing data into QIIME 2 needs to have a very good understanding of what format their data is in, and then learn how to provide that information to QIIME 2.
This chapter will provide an overview of importing data into QIIME 2, focused on the most common importing tasks.
Why is importing necessary?
Importing fastq files is the most common importing task among QIIME 2 users, so I’ll discuss why importing is necessary using fastq as an example. Fastq files store sequence and associated sequence quality information. They use a clever approach for representing quality information that enables the quality information to be represented in the same number of characters as the sequence itself. For example, here is a single sequence and quality record from a fastq file:
@M00176:65:000000000-A41FR:1:1101:9905:3163 1:N:0:0
AACCAGCACCTCAAGTGGTCAGGATGATTATTGGGCCTAAAGCATCCGTAGCCGGATCTGTAAGTTTTCGGTTAAATCTGTACGCTCAACGTACAGGCTGCCGGGAATACTGCAGATCTAGGGAGTGGGAGAGGTAGACGGTACTCGGTAG
+
AHAABBABFBFFGGGDGBGGGECFGHHHHHHHHGHHGGHHHHHFHHHGFHGGHGGGGGHHHHHFHHHHHGGGGGHHHHHGHHHHFGEEGHGHHHGGHGHGGHGGGGGHHHHHHHHHHHHFHHGGGCFFGHGGGGFFDGGFG<GEHHGGG/C
The line beginning with the @ symbol indicates the beginning of a new sequence
record. It is followed by an identifier for this sequence that, in this example,
was generated during an Illumina MiSeq sequencing run. The next line contains
the sequence. The line beginning with the + symbol indicates the end of the
sequence, and the last line indicates the quality of each base call in the
sequence. Each of the characters on this line represents an encoded Phred
quality score. For example, in this fastq file A might represent a quality
score of 32, and H might represent a quality score of 39. You can refer to a
simple translation table such as this
one,
to decode the quality scores. That seems simple enough - so what’s the problem?
Well, it starts with the fact that the encoding of these quality characters
isn’t necessarily the same across different fastq files. In another fastq file,
A might represent a quality score of 1, and H might represent a quality
score of 8. You could look again those values up in a translation table, but it
would have to be a different translation table this time. The major problem here
though is that the fastq file itself doesn’t contain explicit information about
what encoding scheme was used. When trying to interpret the information in the
file, without additional context you won’t know if A represents a high quality
base call or a low quality base call. Ouch! There are some approaches that can
be applied to infer how scores are encoded, but they are not completely reliable
and it can be computationally expensive to figure out. The burden is on the
person working with the fastq file to know which encoding
scheme is used.
One of the core design goals of QIIME 2 was that it should keep track of the
meaning of data in the files it’s using, such as how quality scores are encoded
in fastq files. This removes that burden from the user, and ensures that someone
who encounters the data at a later time (for example, you or your boss in five
years) will know how to interpret it. Continuing with the example of fastq
files, because the quality score encoding scheme isn’t stored in fastq files,
that means that QIIME 2 needs to keep track of it alongside the data. That’s
where our QIIME 2 artifacts come in. Remember, these are just .zip files with
a different extension (.qza). They store the fastq data (in the data/
directory), but also metadata that explicitly defines how quality scores are
encoded. When a user imports fastq files into QIIME 2, they must tell the system
what encoding scheme is used. QIIME 2 will keep track of it from there, and
until you choose to export fastq files from a QIIME 2 artifact you will
unambiguously know what encoding scheme is used in your fastq files.
Importing is the step when you must provide specific information about your data
to QIIME 2, and sometimes that information can be challenging to compile. The
good news is we’re here to help on the QIIME 2 Forum and we frequently help
users navigate this tricky step. You can find the most recent questions about
importing data on the QIIME 2 Forum under the import
tag. We’re also working on tools that will
simplify the most common types of data imports in QIIME 2. Because of the huge
number of file formats in bioinformatics though, it’s not a trivial task.
Determining how to import your data
When you import data into QIIME 2 you must provide the semantic type of the data and the file format (or file type) that the data is represented in. These concepts were contrasted earlier - refer back to that discussion now if you need to.
While most users begin their QIIME 2 analysis with raw sequencing data, you can
import data at any step of a QIIME 2 analysis. For example, another common
approach users take is importing feature tables from .biom files. This might
happen if a user wishes to process their raw data with another analysis tool,
but then use QIIME 2 for visual data exploration and statistical analysis.
The first step in determining how to import your data is figuring out what it is that you’re trying to import. Fig. 1 presents a flow chart that will get you get started. Follow the references in the flow chart to other sections in this chapter. If you suspect that you may have a particular type of data but are not sure, refer to the section that the flowchart would direct you to if you had that type of data. Each section will begin with a definition the type of data.
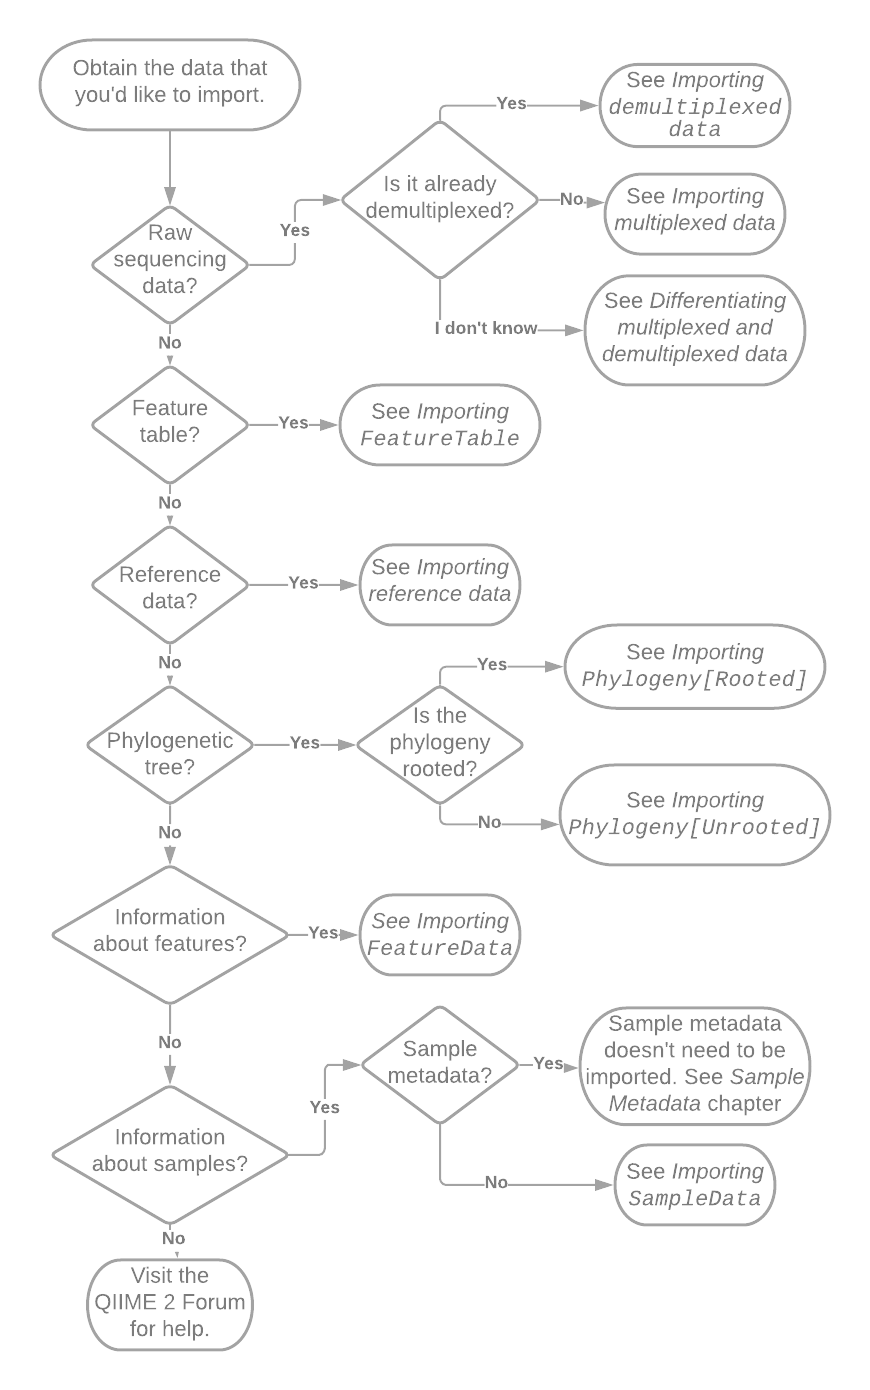
Fig. 1 Flowchart illustrating initial decisions made during importing. Pointers such as “See Importing SampleData” reference other sections of this chapter or book.
Summary
QIIME 2 is more explicit about the meaning and format of data than most bioinformatics tools, and as a result we’ve had to invent some language to describe these things. This creates a bit of a circular dependency when you’re just getting started: experience with QIIME 2 helps you to understand how to import data, but you have to import data to get experience with QIIME 2. As you gain experience with QIIME 2, you’ll learn its language of semantic types and you’ll be less dependent on the flow charts and other information in this chapter. You’ll probably still refer back to importing documentation from time to time though - I certainly do.